Rich Households Taxable Income and the Lowering of the Family
Quotient Ceiling:
A French natural experiment.
Adrien Pacifico
AMSE, THEMA
## Roadmap:
1. Literature review
2. Institutional Background
3. The Tax Reform in Detail
4. Empirical Approcach
5. Results
6. Conclusion
### Today's topic:
We want to see how __rich French married couples__ (with children) reacted on the taxable income margin to a recent fiscal reform.
### Why is it important?
1.
* Income tax is an important redistributive instrument.
* Behavioral reactions of households are crucial for the Equity-Efficiency Tradeoff ( [Mirlees(1971)](https://www.jstor.org/stable/2296779?seq=1#page_scan_tab_contents), [Saez(2001)](https://academic.oup.com/restud/article-abstract/68/1/205/1568609)).
2. The 9 th decile of the income distribution account for most of the aggregated income tax.
### What do we know?
A very large literature exists, and can be splitted in two (close) fields of research.
* The Labor economics literature ([Blundel & al (1999)](https://www.sciencedirect.com/science/article/abs/pii/S1573446399030084), [Keane(2011)]( https://www.aeaweb.org/articles?id=10.1257/jel.49.4.961))
* The Elasticity of Taxable Income literature [(Saez & al (2012)](https://www.aeaweb.org/articles?id=10.1257/jel.50.1.3)
### These two literatures find very similar results:
1. Behavioral reactions are very small.
2. Married women reacts, mostly on the extensive margin.
3. While substitution effects are small, income effects are neglictable.
### Institutional Background
The reform we are going to look at is a lowering of a ceiling that determines the maximum per child tax-deduction.
It happened twice in 2012 and 2013. The per child maximum tax-break has been shifted from 2336 € to 2000 and then to 1500 €.
Timing:
- March 2011: François Hollande has declared himself as a candidate to the French presidency.
- October 2011: François Hollande won the left primary.
- January 2012: He conveys the idea of the reform in unprecised manner.
- May 2012: François Hollande won against former president Nicolas Sarkory with 51.62% of the votes
- September 2012: the lowering from 2336 euros to 2000 euros is annonced.
- December 2012: the law is passed and applied to 2012 incomes. Households discover their "new" tax in January or May 2013.
- September 2013: new lowering to 1500 € (voted in december) and applied to 2013 incomes, Households discover their "new" tax in January or May 2014.
Reaction:
- Jan-Dec 2011: During year 2011, it was hard to plan the reform
\(\implies \) No behavioral reaction in 2011.
- Jan-Dec 2014: The reform impacted households fully on their 2013 income
\(\implies \) They can fully react in 2014.
## The Family Quotient Ceiling
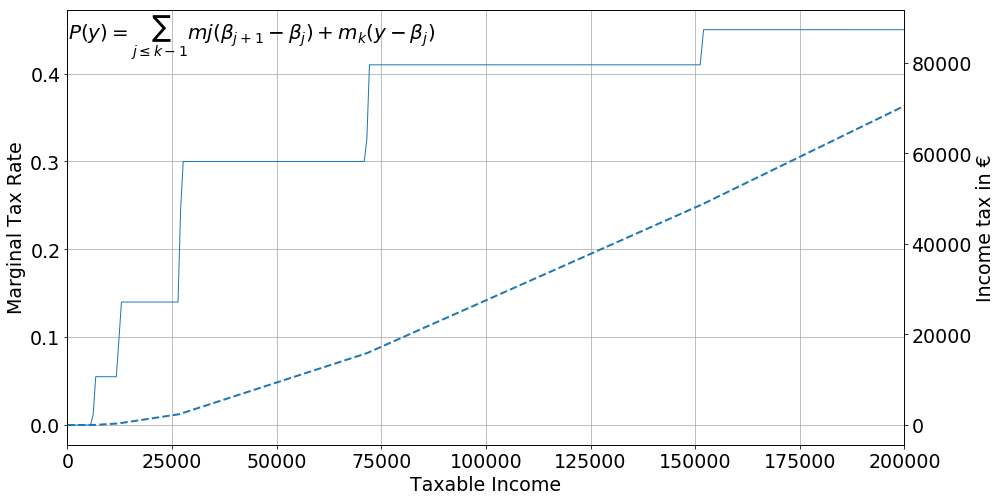
The Piecewise Linear Tax Scheme:
A piecewise linear tax scheme is a serie of tax brackets with their associated tax rates.
![]()
|
2011 |
|
Rate |
Threshold |
| 0 |
0 |
0 |
| 1 |
0.055 |
5,963 |
| 2 |
0.14 |
11,896 |
| 3 |
0.3 |
26,420 |
| 4 |
0.41 |
70,830 |
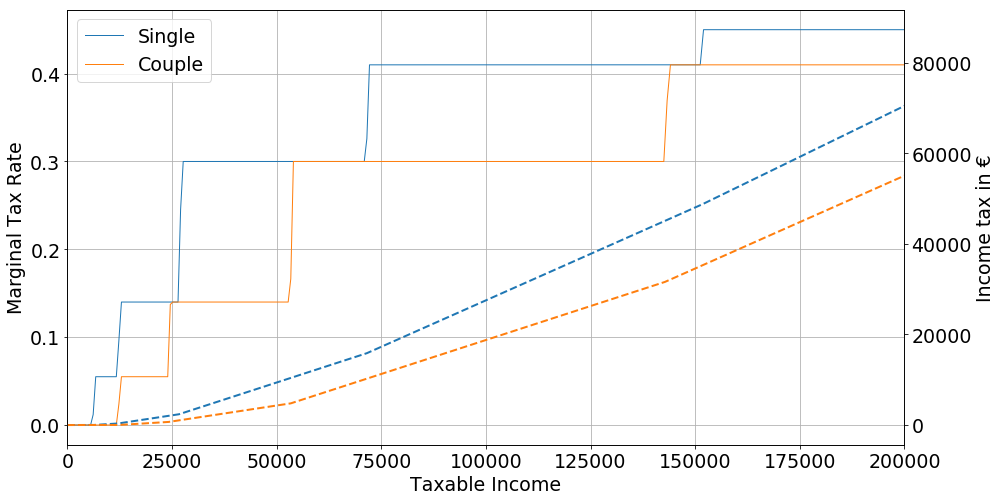
The family quotient
It consist of dividing the tax base by a given amount of fiscal shares in order to apply it to the piecewise linear tax scheme:
$$
T(y, \text{fiscal shares}) = \mathcal{P} \left( \frac{
\sum_{i} y_i}
{ \text{fiscal shares}} \right) \times \text{fiscal shares}
$$
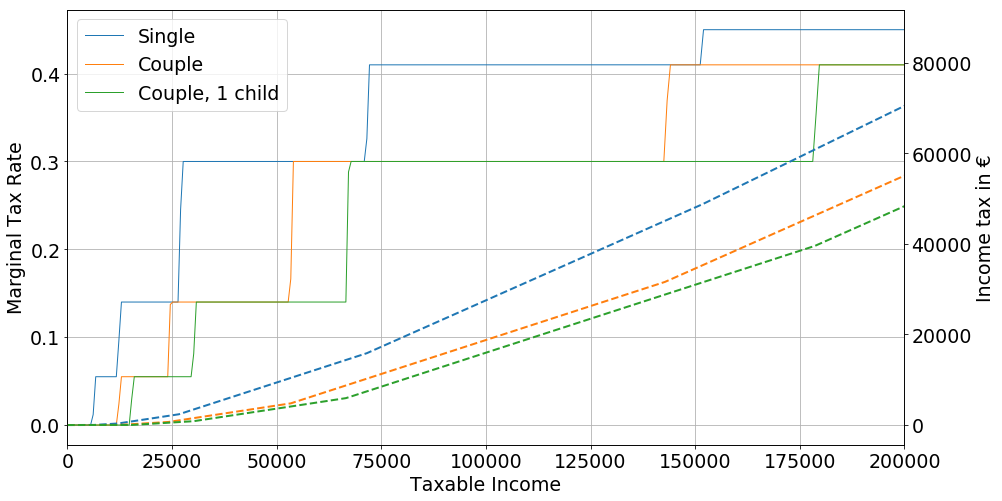
The number of additional fiscal share per child is 0.5 share for the two first children, and 1 share for following children.
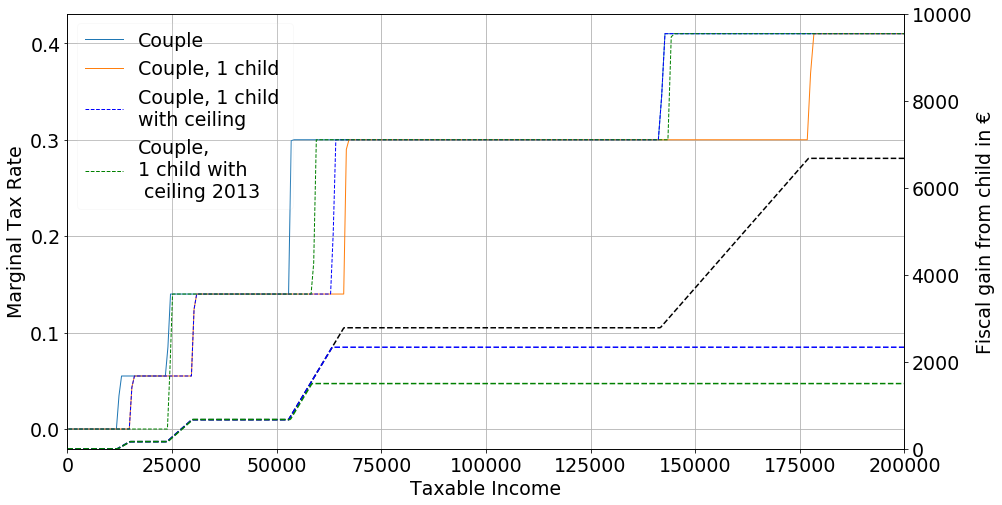
However there exist a ceiling limiting the fiscal gain per half fiscal share to 2336 €.
![]() However there exist a ceiling limiting the fiscal gain per half fiscal share to 2336 €, and has been lowered to 1500 € in 2013.
However there exist a ceiling limiting the fiscal gain per half fiscal share to 2336 €, and has been lowered to 1500 € in 2013.
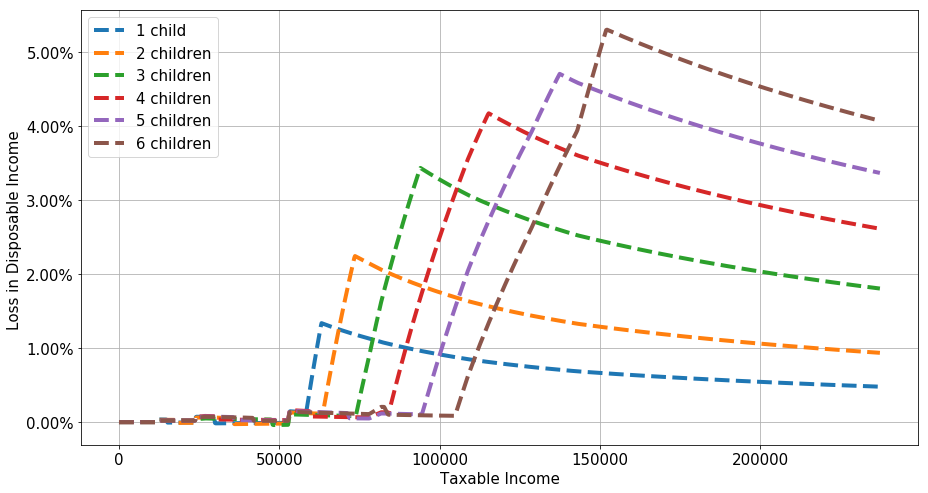
![]() It implies a series of thresholds given the number of children at which the MTR changes or at which households will face a lump sum decrease of their disposable income.
It implies a series of thresholds given the number of children at which the MTR changes or at which households will face a lump sum decrease of their disposable income.
|
2011 |
2013 |
| Children # |
|
|
| 1 |
63158 |
58388 |
| 2 |
73615 |
63426 |
| 3 |
94419 |
73874 |
| 4 |
115287 |
84178 |
| 5 |
136064 |
94509 |
| 6 |
150656 |
104633 |
An important loss:
![]() No other tax reforms or policy happened on the \(\text{50 000}\) €, \(\text{200 000}\) € over the 2012-2014 period.
No other tax reforms or policy happened on the \(\text{50 000}\) €, \(\text{200 000}\) € over the 2012-2014 period.
To the exception of:
- The suppression of a unique tax transfer on capital.
- A change in the retirement age to get a full pension .
Figures has been generated with Openfisca, a more compleate description of the reform will be (soon) put on www.github.io/adrienpacifico/qf_lowering in a auto-executable Jupyter notebook format.
The analysis of behavioral reactions with respect to net of tax wage changes face an identification issue:
* A change in marginal tax rate (MTR), happens on a specific part of the income distribution.
* As a consequence it is not possible to disentengle the impact of a change in the income distribution, and a behavioral reaction to a change in net-of-tax income.
As noted by [Piketty (1999)](http://piketty.pse.ens.fr/fichiers/public/Piketty1999f.pdf) the family quotient adds an other source of variation that allows to control for the change in the income distribution.
The family quotient embodies a triple-difference estimator.
Even if that additionnal source of variation as been used implicitely (or explicitely) by numerous French studies ([Carbonier (2014)](http://www.sciencespo.fr/liepp/sites/sciencespo.fr.liepp/files/WP23_0.pdf),[ Lehmann et al (2014)](https://www.sciencedirect.com/science/article/abs/pii/S0047272713000170), [Sicsic (2018)](https://afse2018.sciencesconf.org/192694/document)), no recent studies has used it with a triple-difference setting.
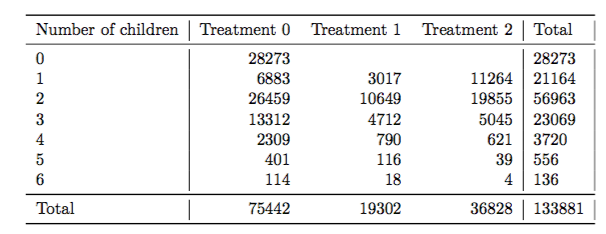
The reform creates three separate groups:
* An untreated one that is below the two thresholds.
* One that face a change in MTR (Treatment 1).
* One that face a lump sum decrease in disposable income (Treatment 2).
We make the assumption that in the absence of reform, households would have stayed in the same position in the income distribution.
#### The Échantillon Démographique Permanent:
* Large dataset composed of 62 databases.
* Over 2 millions households in panel, with fiscal returns.
* Large set of controls.
$$~$$
##### What I Do:
* Use the taxable income in 2011 and 2014.
* On married households with and without children.
* Taxable income between 50 to 200k € in 2011 or in 2014.
Classical diff-in-diff:
$$ y_{it} = \beta_0 + \beta_1 \text{Post} + \beta_2 \text{Treated} \\ + \delta \text{Treated} \times \text{Post} + c_i + \epsilon_{it} $$
Which can be estimated in first difference:
$$ \Delta y_{i} = \beta_1+ \delta_1 \text{Treated} + \epsilon_{i}$$
In our case we can do:
$$ \Delta y_{i} = \beta_0+ \beta_1 \text{Treatment}_1 +\beta_2 \text{Treatment}_2 + \epsilon_{i}$$
| Intercept |
Treatment 1 |
Treatment 2 |
5315***
(37) |
-218**
(105) |
-823***
(81) |
|
|
|
That estimation doesn't take into account potentiel changes due the change in the income distribution.
It also does not take into account potentiel difference in trend based on family composition.
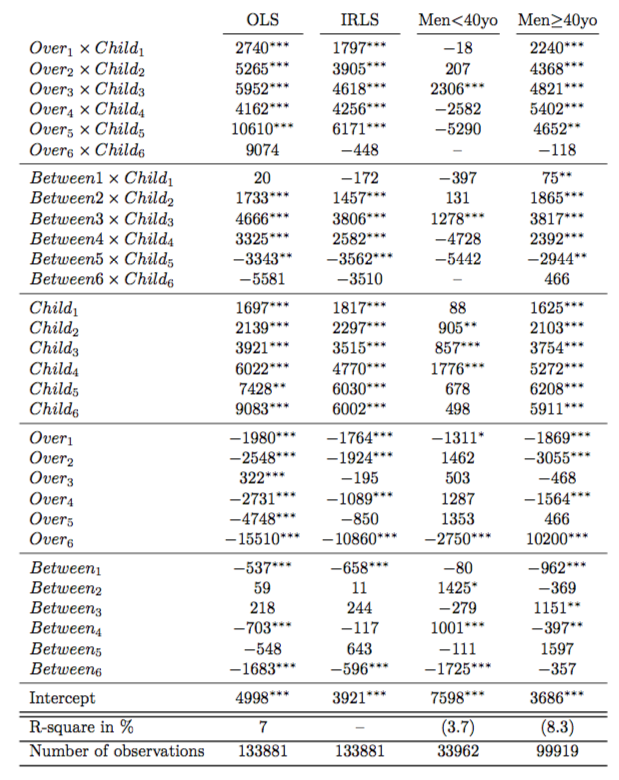
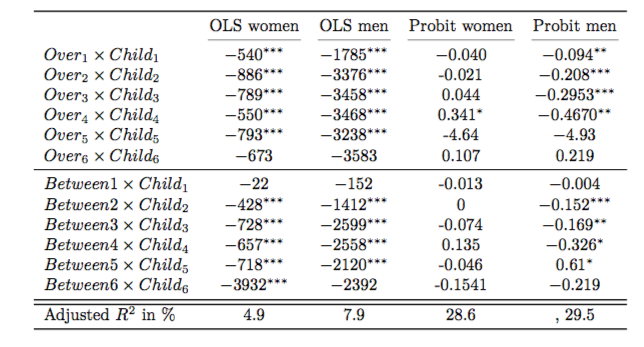
A triple-difference estimator:
$$\begin{align*}
\Delta y_i &= \beta_0 + \sum_{i=1}^{6} {\beta_i \text{Children}_i} + \sum_{j=1}^{6} {{}_{b}\delta_i \text{Between}_i} + \sum_{i=1}^{6} {{}_{o}\delta_i \text{Over}_j} \\
&+ \sum_{i=1}^6 {{}_{b}\gamma_{i} \text{Children}_i \times \text{Between}_i} \\
&+ \sum_{i=1}^6 {{}_{o}\gamma_{i} \text{Children}_i \times \text{Over}_i} \\
& + \epsilon_i
\end{align*}$$
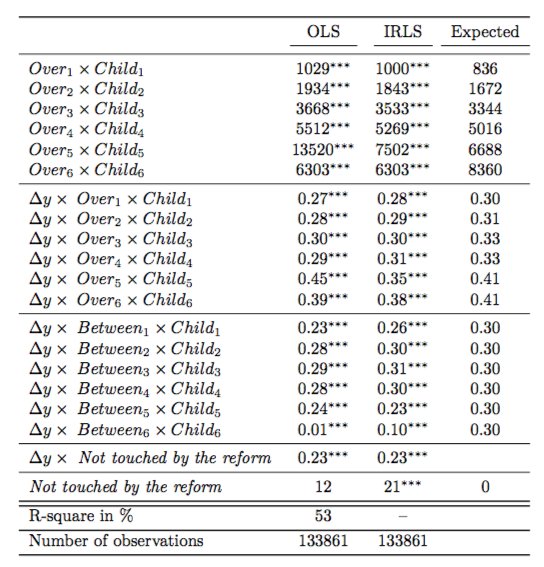
How well the reform is fitted by the estimation ?
$$\begin{align*}
\Delta T =& \sum_{i = 1}^{6} \beta^{O}_{i} child_i \times Over_i + \sum_{i=1}^{6} \beta^{MTR_O}_i \Delta y \times child_i \times Over_i \\
&+ \sum_{i=1}^{6} \beta^{MTR_B}_i \Delta y \times child_i \times Between_i \\
&+ \gamma \Delta y \times \text{ Not touched by reform} \\
&+ \theta \times \text{Not touched by reform} + \epsilon_i
\end{align*} $$
How well the reform is fitted by the estimation ?
![]() * A study on top 10% households without the top 1%.
* First study to use the EDP for tax related purposes.
* Relates on a unique natural experiment that allows to capture the income effect.
* A (new) approach that allows to be structurally free of the change in distribution bias.
* I find large income effect, most likely due to households that wants to keep up with their standars of living.
* The income effect usually dominate the substitution effect, but the substitution effect become more important for larger income.
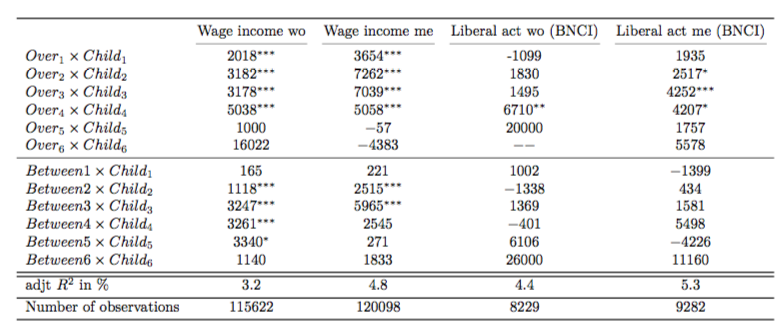
* Women tend to react less than men.
* Economics is usually non reproducible [Chang & Li (2015)](https://www.federalreserve.gov/econresdata/feds/2015/files/2015083pap.pdf) .
* Tax reform analysis is very sensible to data selection [kopczuk (2005)](http://www.columbia.edu/~wk2110/bin/taxBase.pdf).
* Availability of code (data preparation and estimation) is not good.
* Administrative data leads to a very high (fixed) reproducibility cost.
* One solution is to publish all the code, with as much non identifying output as possible, that allows to see exactly what has been done to attain such results.
* A study on top 10% households without the top 1%.
* First study to use the EDP for tax related purposes.
* Relates on a unique natural experiment that allows to capture the income effect.
* A (new) approach that allows to be structurally free of the change in distribution bias.
* I find large income effect, most likely due to households that wants to keep up with their standars of living.
* The income effect usually dominate the substitution effect, but the substitution effect become more important for larger income.
* Women tend to react less than men.
* Economics is usually non reproducible [Chang & Li (2015)](https://www.federalreserve.gov/econresdata/feds/2015/files/2015083pap.pdf) .
* Tax reform analysis is very sensible to data selection [kopczuk (2005)](http://www.columbia.edu/~wk2110/bin/taxBase.pdf).
* Availability of code (data preparation and estimation) is not good.
* Administrative data leads to a very high (fixed) reproducibility cost.
* One solution is to publish all the code, with as much non identifying output as possible, that allows to see exactly what has been done to attain such results.